
Betting
MLB Odds Explained: How to Identify Mispriced Lines
Novice bettors look at an MLB line and fixate on the underdog/favorite and the potential payout. In contrast, pros are much more interested in the implied probability and how it compares to their own model. Stick around as I show you how to start thinking a little more deeply about MLB odds!

SportsBoom offers honest and impartial bookmaker reviews to help you make informed choices. While we may earn commissions through affiliate links, our content remains independent and free from promotional influence. For more information, see our Content Transparency and How We Review pages.

MLB Odds Explained
What MLB Odds Actually Are
MLB odds are a sportsbook's way of communicating your potential payout and probability of an event happening. MLB markets with negative numbers are for favorites and reveal what you risk to win $100. Positive number odds are for underdogs and show you what you win when you wager $100.
MLB odds also encode an implied probability. For negative odds, you divide the line value by (line value + 100). For positive odds, 100 is divided by (odds + 100).
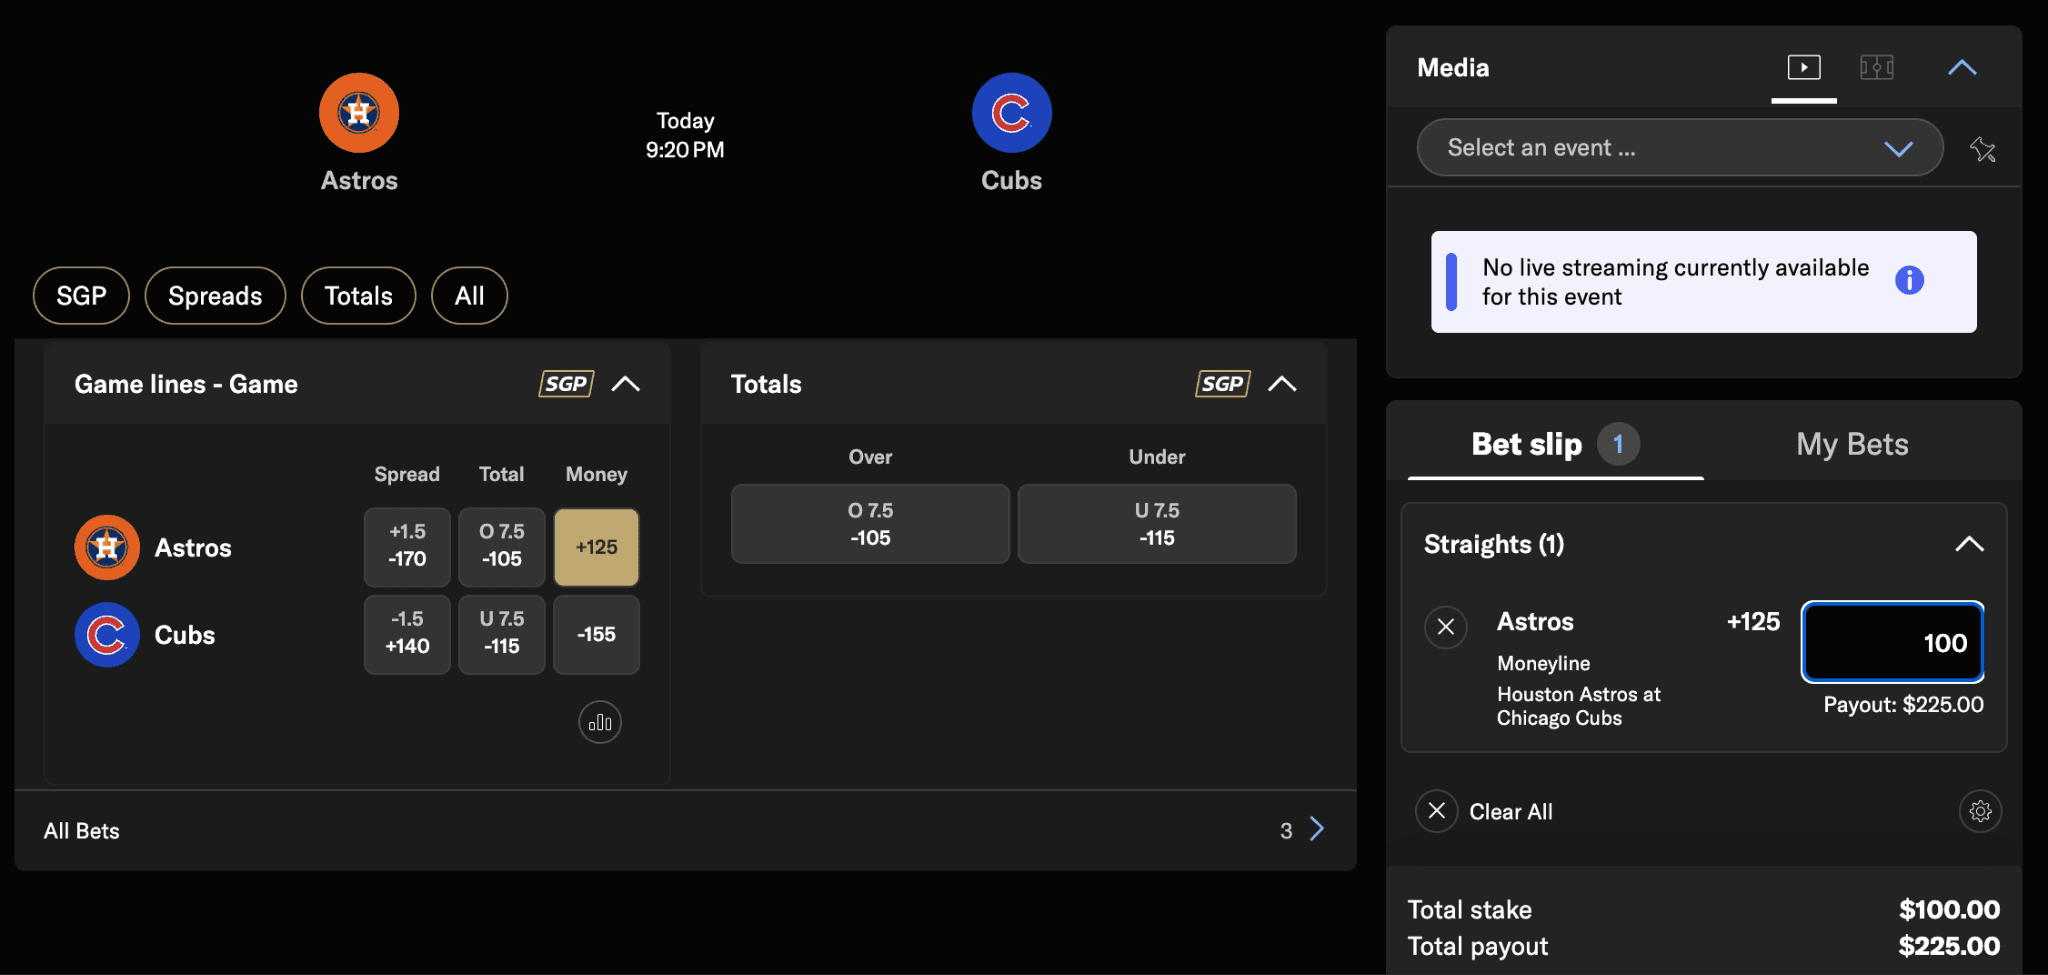
Credit: BetMGM Sportsbook – Screenshot captured by Chad Nagel on May 23
On Saturday, May 23, the Astros were paying +125 to beat the Cubs. With an implied probability of 44.4% (100/(125+100)), the market was saying the Astros are slight underdogs. A $100 bet if Houston won would collect $225 in total.
How Sportsbooks Build the Line
The best sportsbooks brands employ quantitative analysts running predictive models that factor in starting pitcher ERA, bullpen fatigue, lineup construction, park factors, and weather to derive a true probability for each outcome. [1]They then adjust that probability outward to embed their profit margin, known as the vig (vigorish, or juice). [2]
Sportsbooks inflate the implied probability on both sides of a bet so they total more than 100%. That excess is the cut the book keeps regardless of the outcome.
To see the vig in action, I pulled up the run line, which is similar to NBA sportsbooks’ points total for the Tampa Bay Rays vs. New York Yankees game on Saturday, May 23.
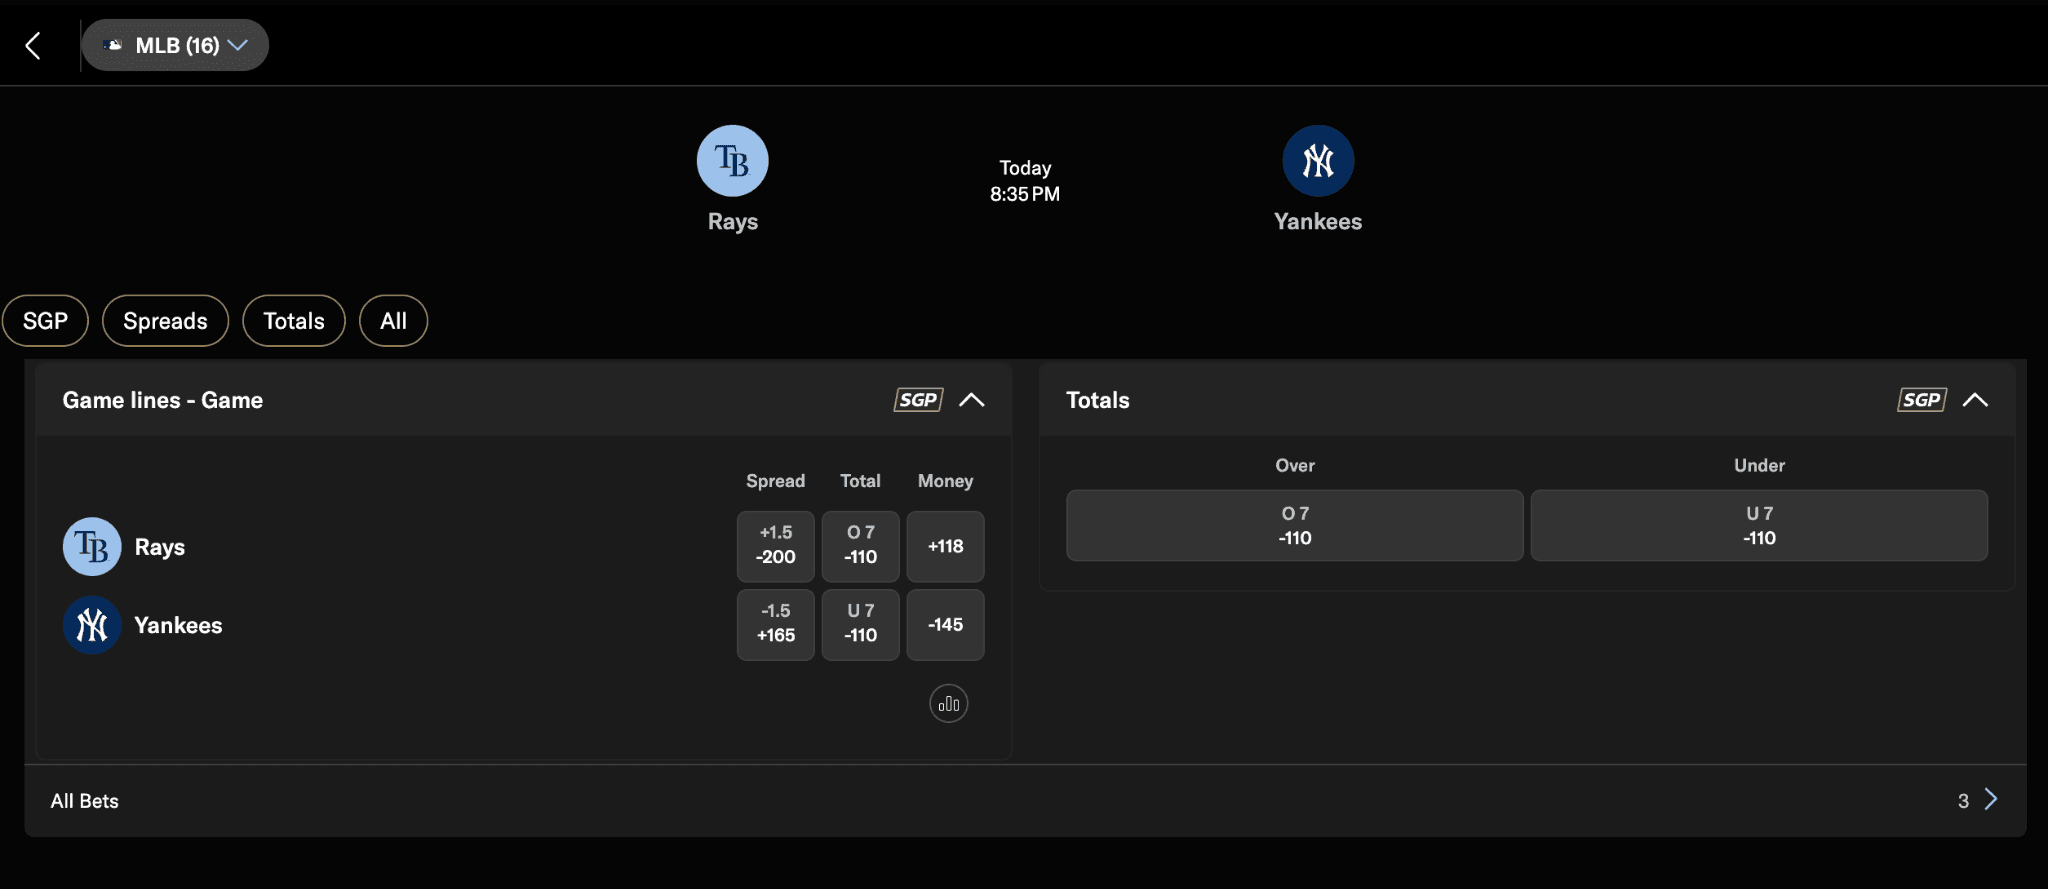
Credit: BetMGM Sportsbook – Screenshot captured by Chad Nagel on May 23
The Rays at +1.5 gives Tampa Bay a 1.5-run head start. The team was paying -200, so you’d need to risk $200 to win $100, and the implied probability of the Rays covering is 66.7%.
The Yankees at -1.5 requires them to win by two or more runs. New York was paying +165, so a $100 stake would return $165, and the book was giving them a 37.7% chance of covering. As you can see, the combined implied probabilities total 104.4%.
That extra 4.4% thrown on is the book’s vig. Anything under 5% is considered fair, but there are reasons the pros avoid exotic markets and parlays where the vig can skyrocket above 10%. [2]
MLB Odds in Action - Pirates vs. Blue Jays
When the Pirates took on the Blue Jays on Saturday, May 23, the run line was at 7.5. I immediately thought that looked a little low. So I pulled up the average run totals and saw the Pirates average 5.38 runs per game at home. While the Blue Jays average 3.58 runs per game on the road, bringing the expected total to 8.96 runs.
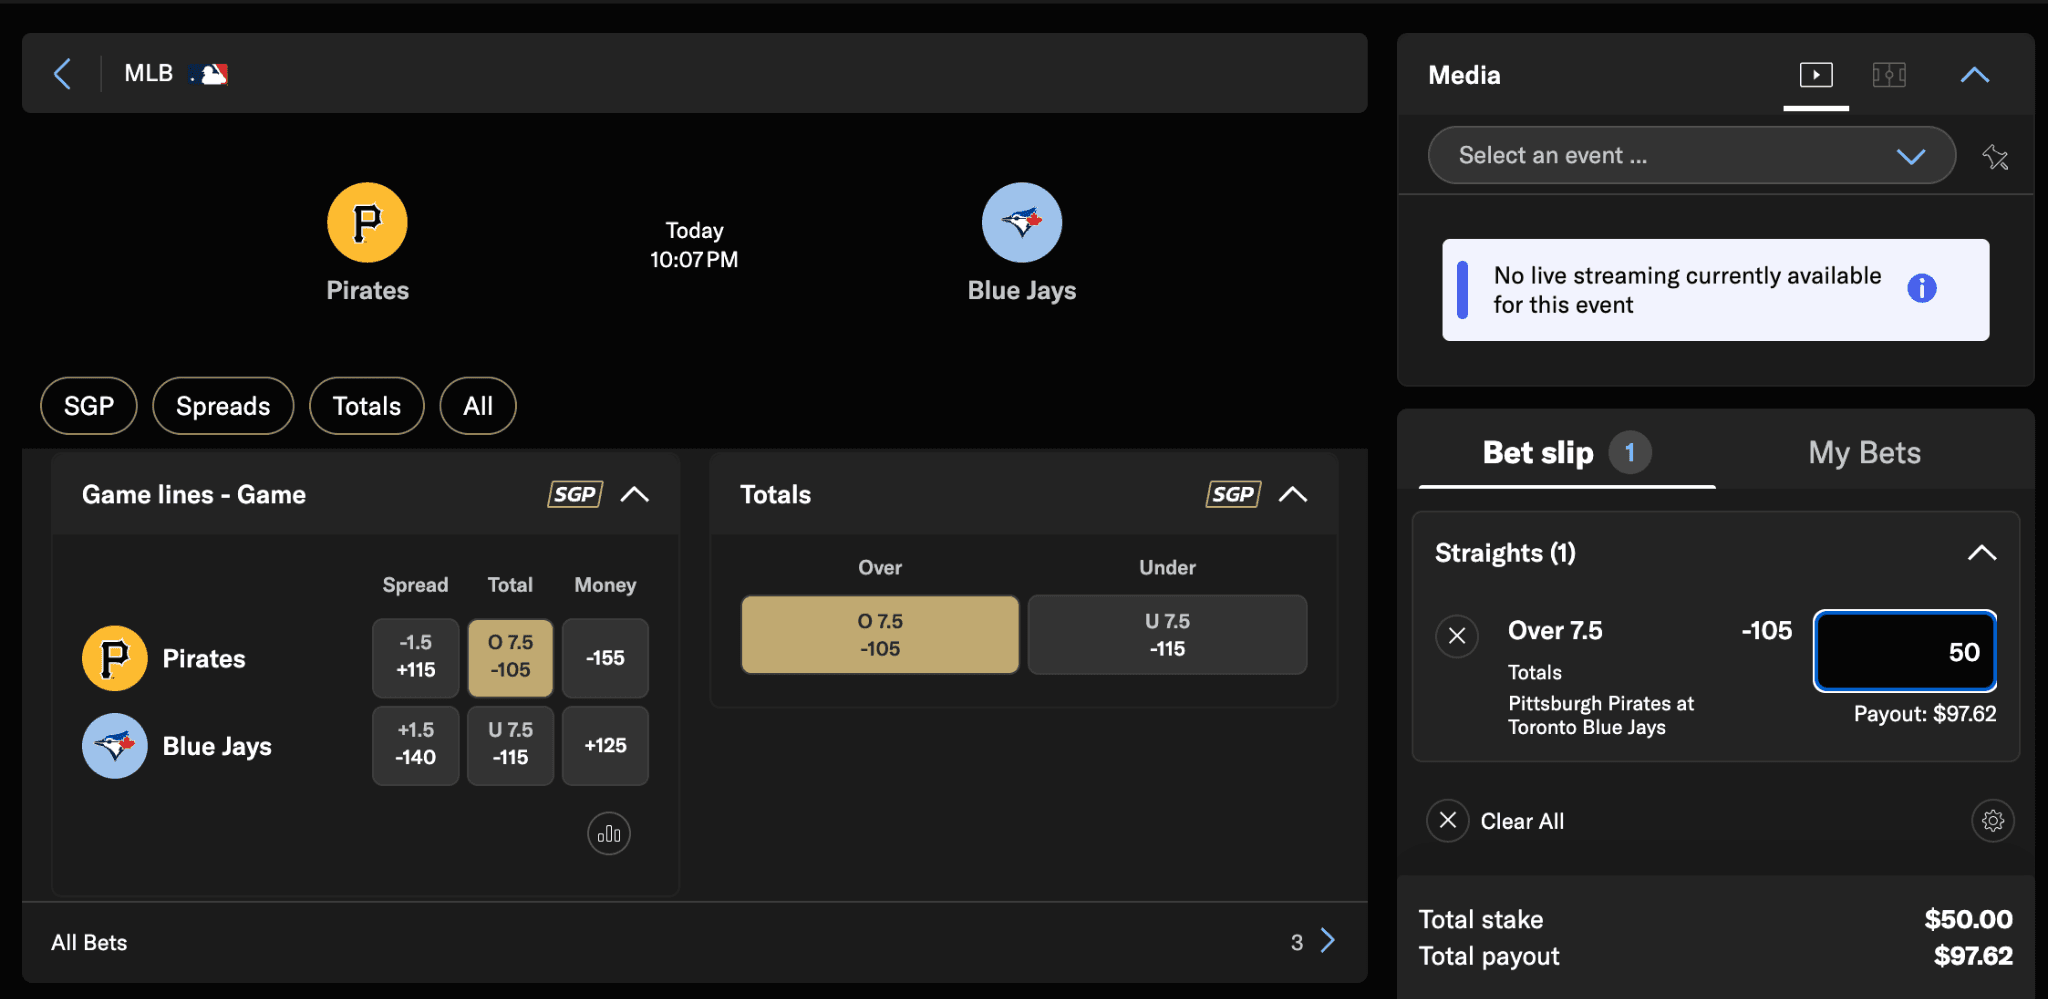
Credit: BetMGM Sportsbook – Screenshot captured by Chad Nagel on May 23
Based on the over paying -105, the book was expecting more than 7.5 runs 51.22% of the time. However, based on the Pirates' strong home form, I put the true probability closer to 56% and decided to place $50 on the over, which had me staring at a potential payout of $97.62!
How Professionals Use Odds
Pros will pull up MLB odds at different sportsbooks and trawl through them. Using their intuition, they’ll identify lines that are potentially mispriced. Then they’ll run the game through their own model, and when their true probability differs significantly from the book’s MLB odds, they’ll place a bet.
So first you need to build your own probability model using pitching matchups, team statistics, park factors, weather, and lineup data. Your model will then generate a number, such as the chance of the Astros beating the Cubs at 50%. Based on the current odds of +125, this would be a profitable bet, as that line suggests an implied probability of 44.44%.
To determine if your model is actually successful, you need to analyze if you’re locking in closing line value (CLV). You’ve achieved CLV if the price you secured was better than where the line closed at game time. If your model beats the closing line 55%+ of the time, you’ve found an edge. [3]
This strategy works for all sports from MLS wagering to UFC betting. You just need to adjust the stats you feed into your model.
The Bottom Line
Every MLB line is the sportsbook's best estimate of true probability with a vig tacked on and then adjusted by public money, sharp action, injury news, and pitching changes. Your job is to form your own probability estimate and compare it to the market's. When your number is significantly higher, you've found a value bet! [4]

Bruce Douglas has more than a decade of experience in sports and news media, working across print and digital platforms.
Comments
0 comments
No comments yet. Be the first to share your thoughts!
References
- 1.Construction of a Predictive Model for MLB Matches - Lin, T-C. & Chou, C-H – MDPI - 16 February 2021. Accessed May 21, 2026
- 2.Weak Form Efficiency in Sports Betting Markets. East Carolina University - Thomas R. Robbins – My Web Ecu Edu. Accessed May 23, 2026
- 3.Market Structure and Prices in Online Betting Markets - Hegarty, T. & Whelan K – Academic OUP - 28 August 2025. Accessed May 23, 2026
- 4.Estimating Expected Loss Rates in Betting Markets - Tadgh Hegarty, Karl Whelan, Tylor & Francis - 24 May 2025. Accessed May 23, 2026
Related Resources to Betting
- Prediction Markets
- Can Online Casinos Replicate the Social Experience of Land-Based Gaming?
- What is the Psychology Behind Jackpot Slots and Players’ Preferences
- Live Sports Betting Odds: Is Sports Betting Better Today?
- Why Slots Drive 80% of US Online Casino Revenue in 2026
- Betting Odds vs Sports Analysts: Who Predicts Games Better?
- Why sportsbooks encourage same-game parlays in the U.S. betting market
- Longshot Parlays in US Sports Betting
- Why Mobile Betting Has Replaced Vegas Trips for Millions of American Bettors
- Are There Reasons Why Free Bets Rule US Sportsbook Offers?
- Instant Withdrawals are the New Standard Driving Player Expectations in Online Betting
- Is There a Reason Why NBA Odds Are Different from Other US Sports?
- How Sportsbooks Legally Shrink Their State Tax Bills
- How Sportsbooks Doubled Their Take From American Bettors
- Why American Bettors Keep Chasing Parlays
- The Reasons NBA Over-Under Totals Are Much Harder to Predict
- MLB Player Props Betting Guide
- Offshore Betting Sites vs Legal US Sportsbooks: Who Wins?
- Why It’s Easy to Deposit But Harder to Withdraw in US Betting Apps
- Rhode Island finally gets a second sportsbook after 7 years of a monopoly